| collect.auto_increment.columns |
5.1 |
在 information_schema 中采集 auto_increment 和最大值。 |
| collect.binlog_size |
5.1 |
采集所有注册的 binlog 文件大小。 |
| collect.engine_innodb_status |
5.1 |
从 SHOW ENGINE INNODB STATUS 中采集状态数据。 |
| collect.engine_tokudb_status |
5.6 |
从 SHOW ENGINE TOKUDB STATUS 中采集状态数据。 |
| collect.global_status |
5.1 |
从 SHOW GLOBAL STATUS(默认开启)中采集状态数据。 |
| collect.global_variables |
5.1 |
从 SHOW GLOBAL VARIABLES(默认开启)中采集状态数据。 |
| collect.info_schema.clientstats |
5.5 |
如果设置了 userstat=1,设置成 true 来开启用户端数据采集。 |
| collect.info_schema.innodb_metrics |
5.6 |
从 information_schema.innodb_metrics 中采集监控数据。 |
| collect.info_schema.innodb_tablespaces |
5.7 |
从 information_schema.innodb_sys_tablespaces 中采集监控数据。 |
| collect.info_schema.innodb_cmp |
5.5 |
从 information_schema.innodb_cmp 中采集 InnoDB 压缩表的监控数据。 |
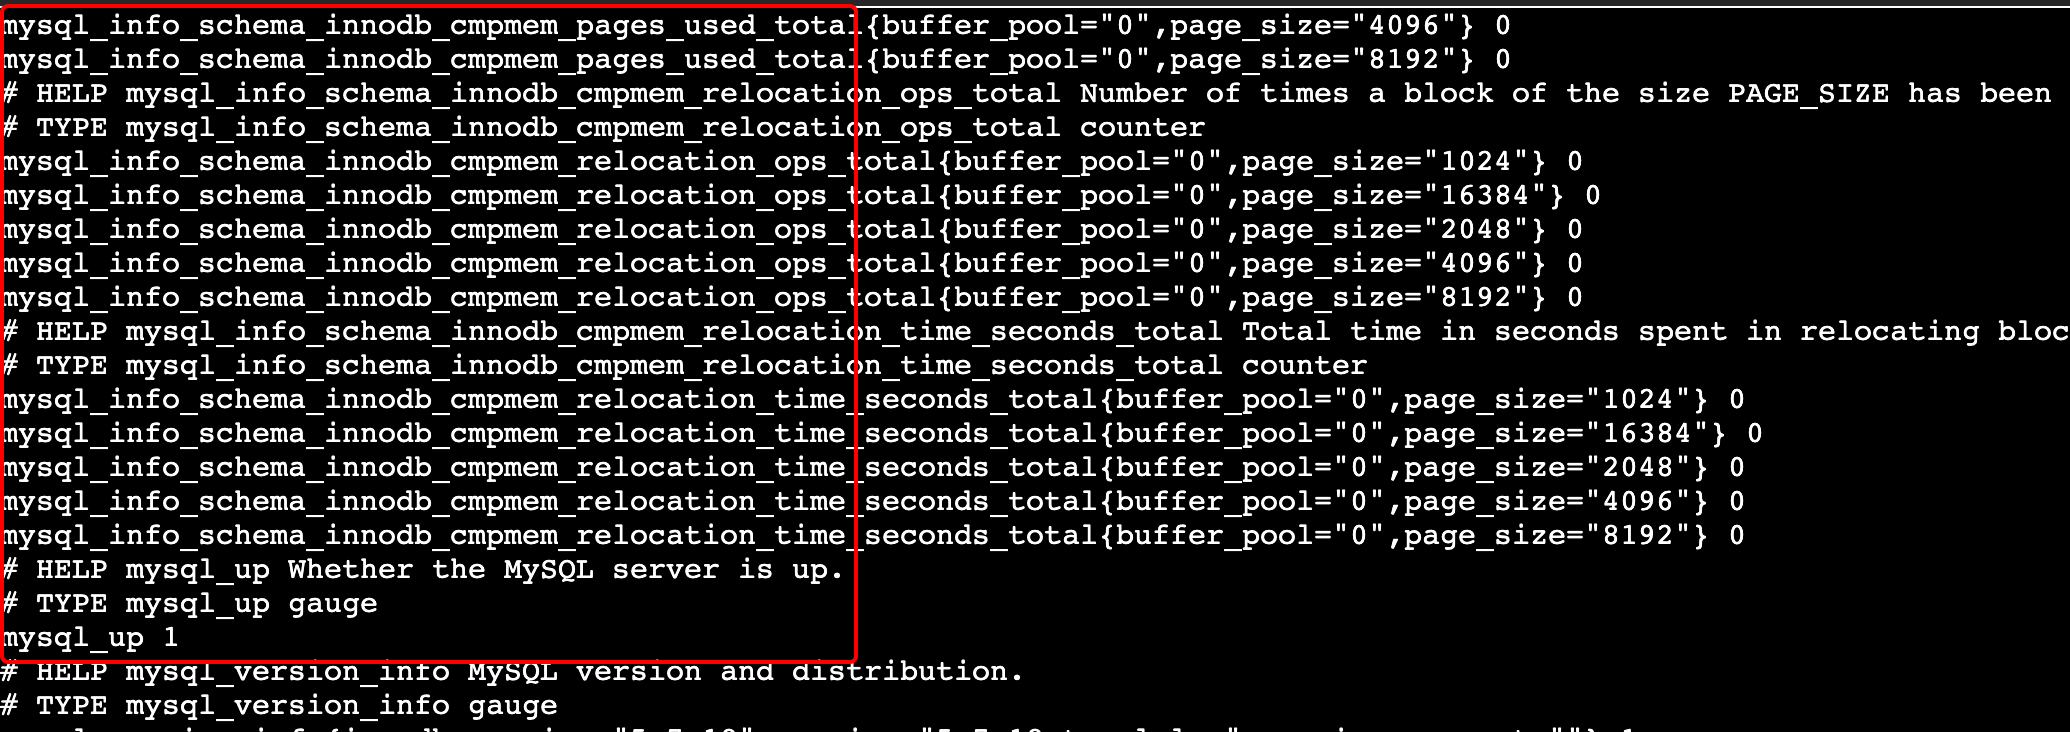
| collect.info_schema.innodb_cmpmem |
5.5 |
从 information_schema.innodb_cmpmem 中采集 InnoDB buffer pool compression 的监控数据。 |
| collect.info_schema.processlist |
5.1 |
从 information_schema.processlist 中采集线程状态计数的监控数据。 |
| collect.info_schema.processlist.min_time |
5.1 |
线程可以被统计所维持的状态的最小时间。(默认:0) |
| collect.info_schema.query_response_time |
5.5 |
如果 query_response_time_stats 被设置成 ON,采集查询相应时间的分布。 |
| collect.info_schema.replica_host |
5.6 |
从 information_schema.replica_host_status 中采集状态数据。 |
| collect.info_schema.tables |
5.1 |
从 information_schema.tables 中采集状态数据。 |
| collect.info_schema.tables.databases |
5.1 |
设置需要采集表状态的数据库, 或者设置成 '*' 来采集所有的。 |
| collect.info_schema.tablestats |
5.1 |
如果设置了 userstat=1,设置成 true 来采集表统计数据。 |
| collect.info_schema.schemastats |
5.1 |
如果设置了 userstat=1,设置成 true 来采集 schema 统计数据。 |
| collect.info_schema.userstats |
5.1 |
如果设置了 userstat=1,设置成 true 来采集用户统计数据。 |
| collect.perf_schema.eventsstatements |
5.6 |
从 performance_schema.events_statements_summary_by_digest 中采集监控数据。 |
| collect.perf_schema.eventsstatements.digest_text_limit |
5.6 |
设置正常文本语句的最大长度。 (默认:120) |
| collect.perf_schema.eventsstatements.limit |
5.6 |
事件语句的限制数量。(默认:250) |
| collect.perf_schema.eventsstatements.timelimit |
5.6 |
限制事件语句 'last_seen' 可以保持多久, 单位为秒。 (默认:86400) |
| collect.perf_schema.eventsstatementssum |
5.7 |
从 performance_schema.events_statements_summary_by_digest summed 中采集监控数据。 |
| collect.perf_schema.eventswaits |
5.5 |
从 performance_schema.events_waits_summary_global_by_event_name 中采集监控数据。 |
| collect.perf_schema.file_events |
5.6 |
从 performance_schema.file_summary_by_event_name 中采集监控数据。 |
| collect.perf_schema.file_instances |
5.5 |
从 performance_schema.file_summary_by_instance 中采集监控数据。 |
| collect.perf_schema.indexiowaits |
5.6 |
从 performance_schema.table_io_waits_summary_by_index_usage 中采集监控数据。 |
| collect.perf_schema.tableiowaits |
5.6 |
从 performance_schema.table_io_waits_summary_by_table 中采集监控数据。 |
| collect.perf_schema.tablelocks |
5.6 |
从 performance_schema.table_lock_waits_summary_by_table 中采集监控数据。 |
| collect.perf_schema.replication_group_members |
5.7 |
从 performance_schema.replication_group_members 中采集监控数据。 |
| collect.perf_schema.replication_group_member_stats |
5.7 |
从 from performance_schema.replication_group_member_stats 中采集监控数据。 |
| collect.perf_schema.replication_applier_status_by_worker |
5.7 |
从 performance_schema.replication_applier_status_by_worker 中采集监控数据。 |
| collect.slave_status |
5.1 |
从 SHOW SLAVE STATUS(默认开启)中采集监控数据。 |
| collect.slave_hosts |
5.1 |
从 SHOW SLAVE HOSTS 中采集监控数据。 |
| collect.heartbeat |
5.1 |
从 heartbeat 中采集监控数据。 |
| collect.heartbeat.database |
5.1 |
数据库心跳检测的数据源。默认:heartbeat) |
| collect.heartbeat.table |
5.1 |
表心跳检测的数据源。(默认:heartbeat) |
| collect.heartbeat.utc |
5.1 |
对当前的数据库服务器使用 UTC 时间戳 (pt-heartbeat is called with --utc)。(默认:false) |

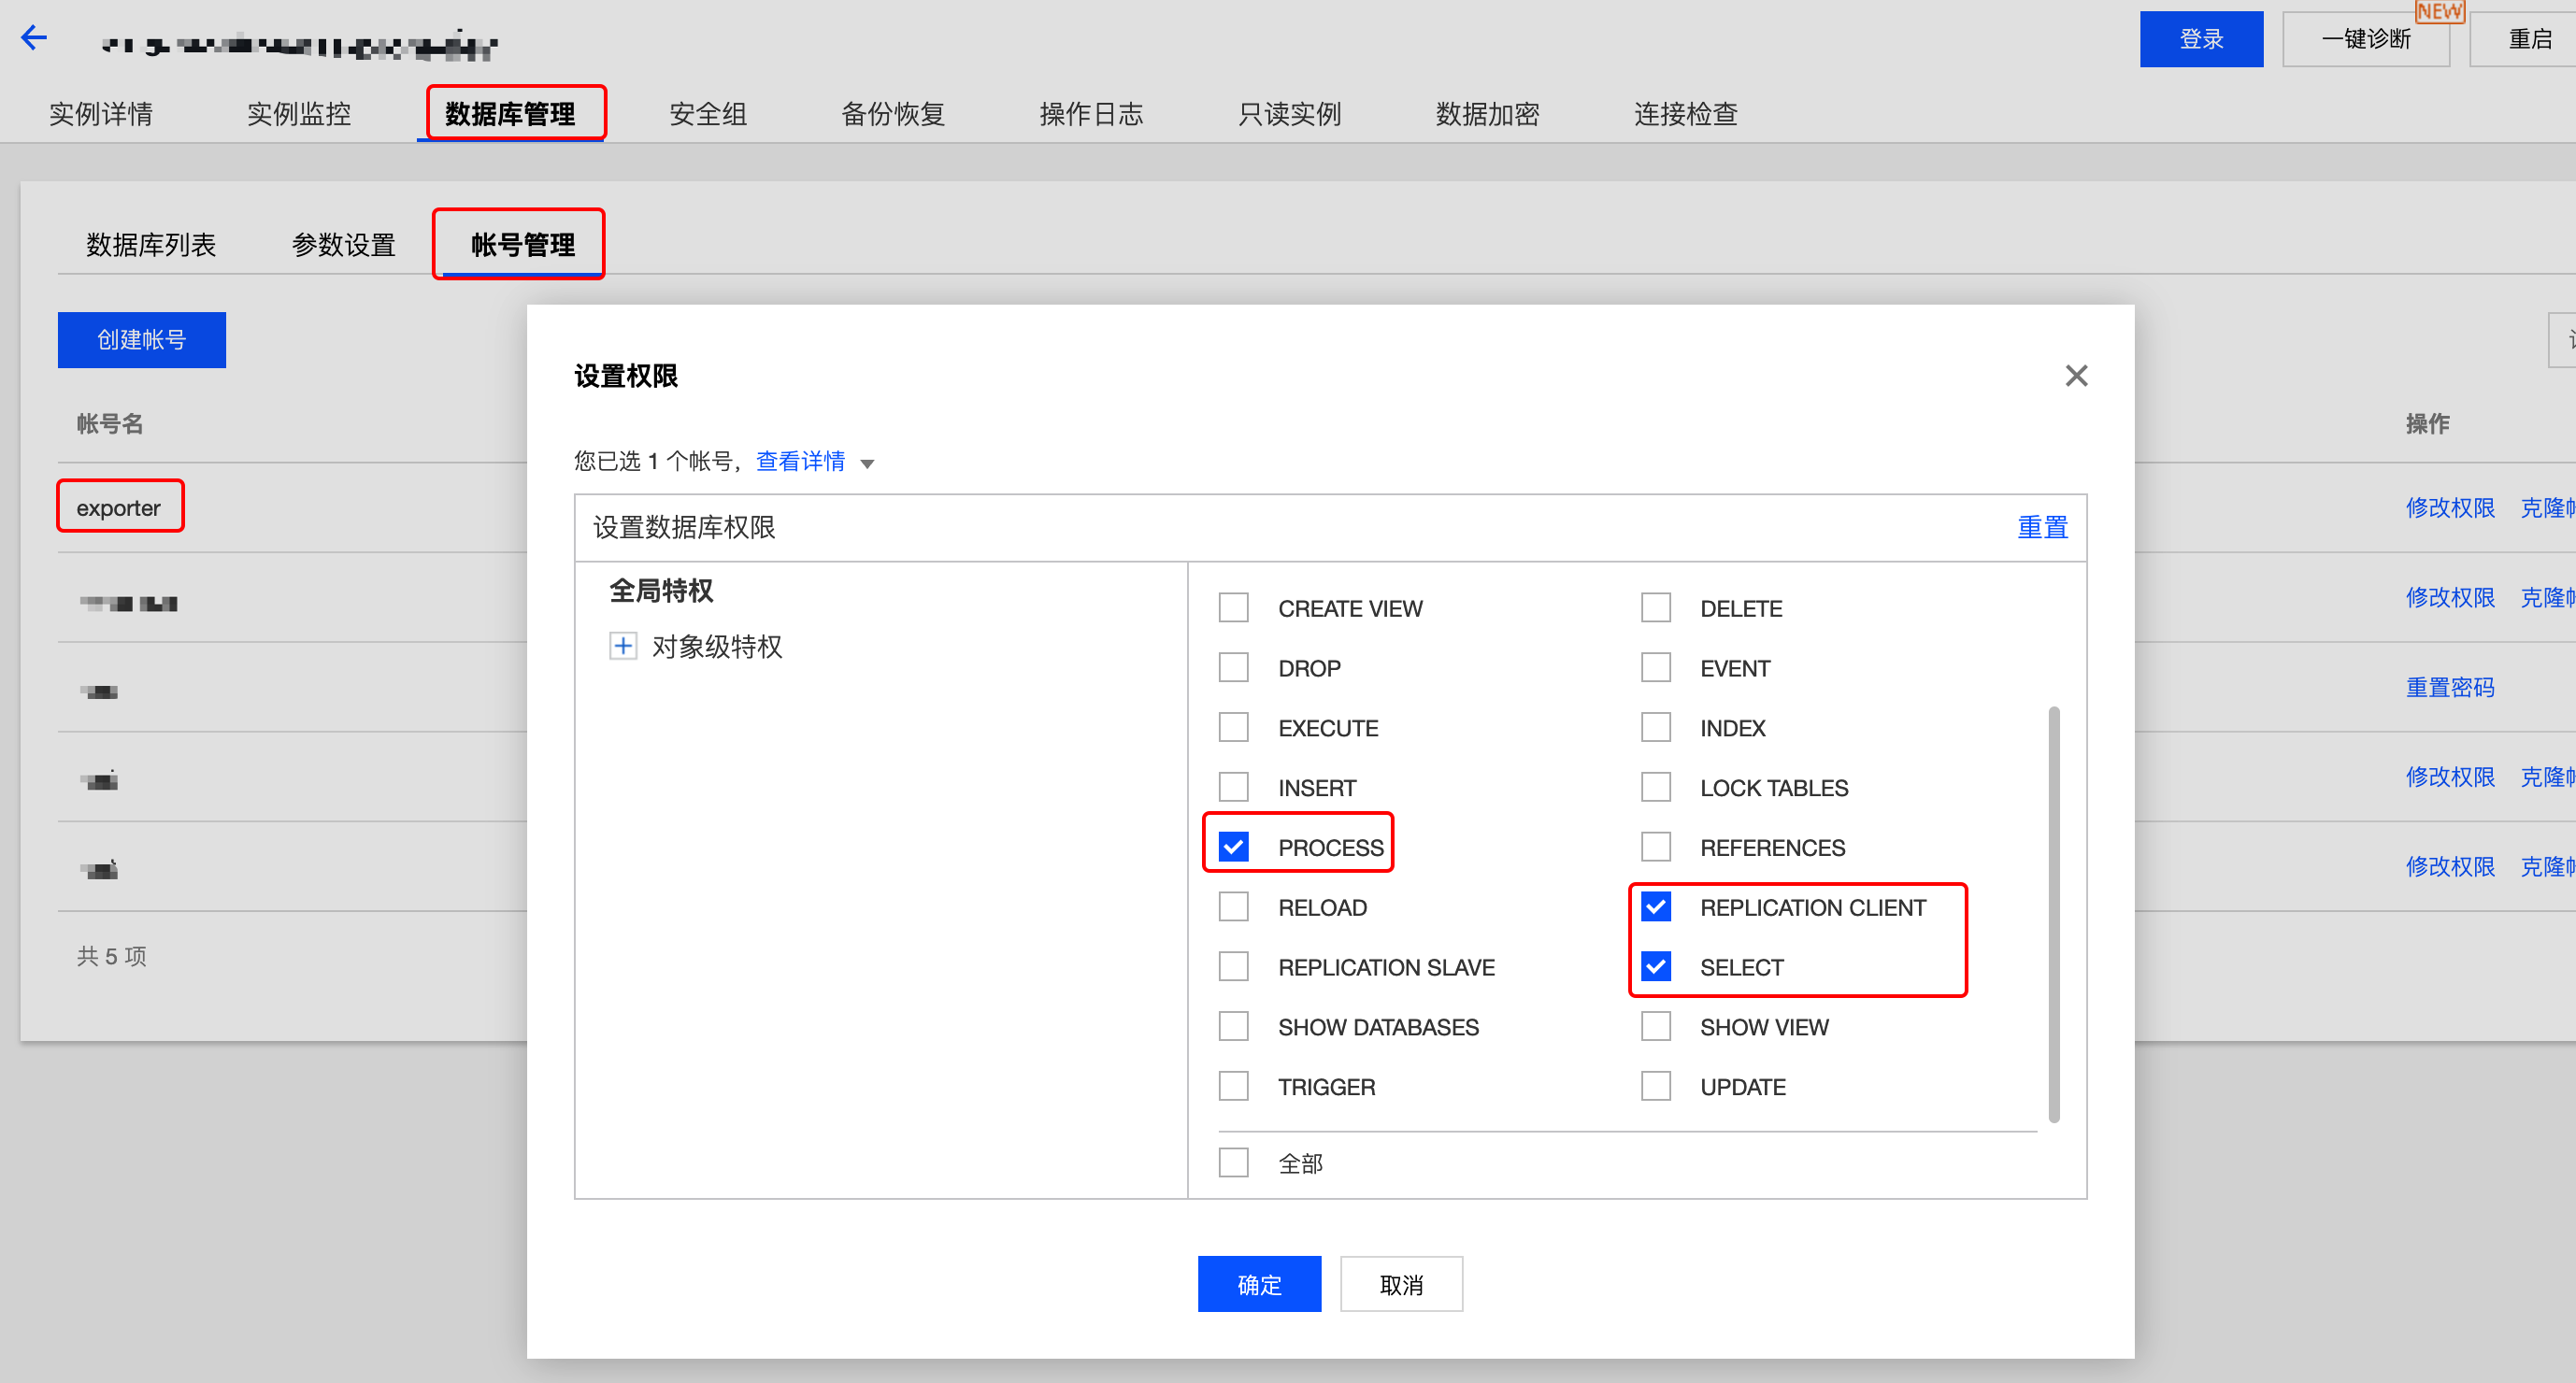 您可以通过执行以下命令进行授权: